ALGO-Backed Lending Markets on DorkFi

Informational — Not Financial Advice (NFA). Do Your Own Research (DYOR).
This post outlines how ALGO-backed lending markets on DorkFi are structured and how to think about them.
It is not a recommendation to deposit, borrow, or take on leverage.
Overview
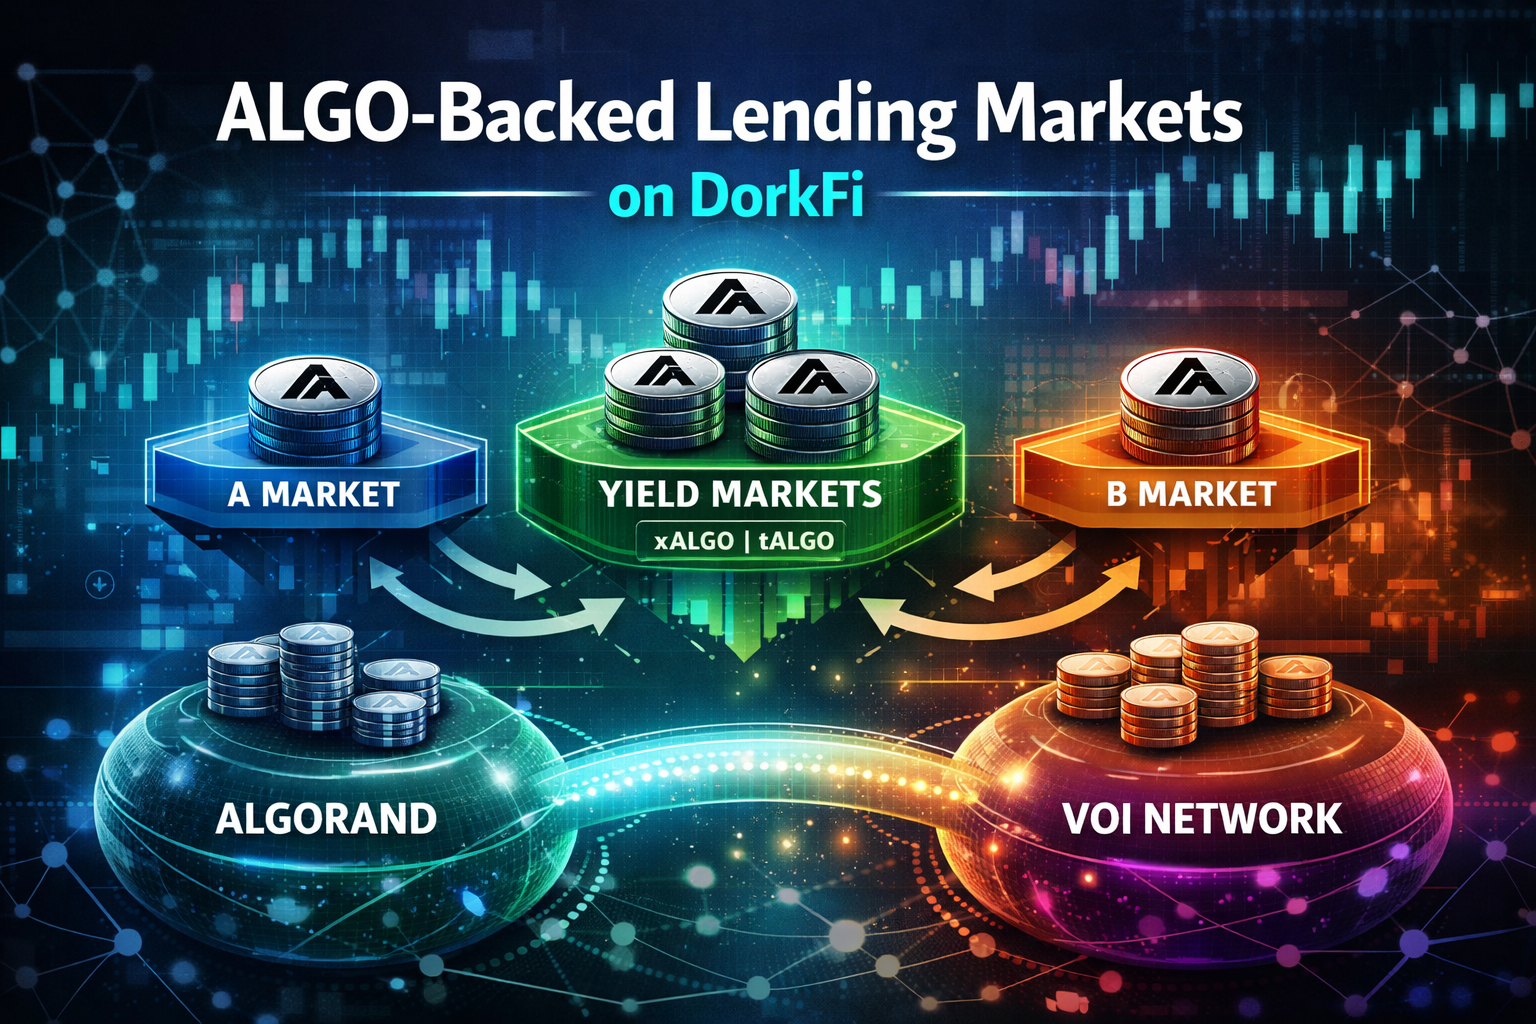
DorkFi organizes ALGO markets into three categories:
- A Markets — base liquidity
- B Markets — leveraged access
- Yield Markets — intrinsic yield + lending
Each serves a different purpose.
Multi-Pool Structure
ALGO is implemented as a multi-pool market.
In total, there are five ALGO-backed markets on DorkFi, each with its own characteristics:
- A Market
- B Market
- Yield Markets (e.g., xALGO, tALGO)
- Additional pool contexts depending on configuration
Each pool defines its own:
- collateral treatment
- rate behavior
- utilization profile
Why This Matters
The same asset can behave differently depending on where it is used.
- one pool may prioritize stability
- another may prioritize leverage
- another may optimize for yield
This allows capital to move between:
- different risk profiles
- different rate environments
- different utilization levels
Same asset. Multiple pools. Different conditions.
Core Idea
At a high level:
Deposit APR = intrinsic yield + lending yield
This is the anchor.
The goal is to:
- remain competitive with external staking yields
- add lending yield on top
- maintain stability under changing utilization
Utilization Drives Everything
Utilization is the key variable:
Utilization = total borrows / total deposits
It determines:
- borrow rates
- supply rates
- overall market behavior
As utilization increases:
- borrow APR increases
- supply APR increases
Caps are used to shape utilization.
Rate Model
Borrow rates follow a simple structure:
Borrow APR = base + slope × utilization
Supply rates are derived from:
- borrow rate
- utilization
- reserve factor
Market Types
A Markets (Base Layer)
Designed for stability and general use.
- Higher collateral factors
- Lower borrow volatility
- Moderate utilization targets
Typical parameters:
- CF: ~75–80%
- RF: ~10–12.5%
- Base: ~0.5%
- Slope: ~6–8%
B Markets (Leverage Layer)
Designed for higher-risk, higher-yield activity.
- Lower collateral factors
- Steeper rate curves
- Stronger utilization response
Typical parameters:
- CF: ~50–65%
- RF: ~20%
- Base: ~2%
- Slope: ~40–45%
Yield Markets (xALGO, tALGO)
Designed to combine:
- intrinsic staking yield
- controlled lending yield
Key idea:
- lending should enhance, not replace, intrinsic yield
Typical parameters:
- Base: ~1%
- Slope: ~35%
- Target utilization: ~8–10%
Cap Strategy
Caps are not arbitrary—they are used to control market behavior.
- Increase deposit cap → lowers utilization
- Reduce borrow cap → lowers borrow APR
- Reduce deposit cap → increases utilization
This allows the system to:
- maintain target utilization ranges
- stabilize rates
- manage risk dynamically
How to Think About These Markets
A simple mental model:
- A Markets → liquidity layer
- B Markets → leverage layer
- Yield Markets → yield enhancement layer
Each has:
- different risk profiles
- different rate behavior
- different intended usage
What Matters
When evaluating a market, focus on:
- utilization
- borrow caps
- deposit caps
- intrinsic yield vs lending yield
Not just headline APR.
Cross-Network Considerations
There are ALGO-backed lending markets on both Algorand and Voi Network.
This creates the possibility for differences in:
- utilization
- borrow rates
- deposit rates
These differences can emerge naturally as each network evolves independently.
Same asset. Different markets. Different rates.
Lending Arbitrage (Conceptual)
When the same asset exists across multiple markets:
- one side may have higher borrow demand
- another may have excess supply
This can create opportunities to:
- supply where rates are higher
- borrow where rates are lower
What Drives These Differences
Differences are typically driven by:
- liquidity distribution
- user behavior
- market maturity
- incentives
Even small imbalances can result in different rate environments.
Bridge Costs
Cross-network lending is not free.
Moving assets between networks may involve:
- non-refundable bridge fees
- execution costs
- timing delays
These costs reduce net yield.
Net Yield Matters
Any cross-network strategy should consider:
- deposit APR
- borrow APR
- bridge costs
- frequency of movement
A higher rate on one network does not guarantee a better outcome.
Practical Implication
If the spread between markets is small:
- bridge costs can eliminate it entirely
- or turn a positive yield into a negative one
Net yield is what matters, not headline rates.
This is informational only.
Always evaluate full cost before acting.
Examples
These examples are simplified and for illustration only.
Example 1 — Base Supply (A Market)
A user deposits ALGO into an A Market.
- Utilization is moderate
- Borrow demand is stable
Outcome:
- earns steady lending yield
- minimal volatility in rates
This is the simplest use case.
Example 2 — Yield Enhancement (xALGO / tALGO)
A user deposits xALGO into a yield market.
- intrinsic staking yield is already present
- lending adds incremental yield
Outcome:
- total yield = intrinsic + lending
- lending portion varies with utilization
Key idea:
- lending should enhance, not replace, base yield
Example 3 — Leveraged Access (B Market)
A user supplies ALGO and borrows against it in a B Market.
- higher borrow rates
- lower collateral factors
Outcome:
- increased capital efficiency
- higher sensitivity to rate changes
This introduces more risk and requires active monitoring.
Example 4 — Cross-Network Rate Difference
ALGO markets exist on both Algorand and Voi.
- Algorand: higher utilization → higher borrow rates
- Voi: lower utilization → lower borrow rates
A user could:
- borrow where rates are lower
- supply where rates are higher
However:
- bridge costs must be considered
- timing and execution matter
Example 5 — Multi-Pool Reallocation
A user holds ALGO within DorkFi.
They may shift between:
- A Market (stability)
- B Market (leverage)
- Yield Market (enhanced yield)
Outcome:
- ability to adapt to changing conditions
- different pools offer different tradeoffs
Examples are simplified and do not account for all risks or costs.
The same asset can produce very different outcomes depending on how and where it is used.
Final
These markets are designed to balance:
- stability
- capital efficiency
- sustainable yield
Caps define utilization. Utilization defines APR.
Always evaluate positions, risks, and assumptions independently.